

Only 2% of marketers used marketing mix modeling, experiments and attribution together to assess marketing impact in 2024, according to WARC data reported by Advanced Television. That gap matters because an attribution report answers who receives conversion credit, not necessarily who generated additional sales. A useful attribution analysis example needs both worked calculations and a test of what would have happened without the affiliate activity.
Table of Contents
- What Attribution Analysis Measures
- Five Attribution Models Applied to One Customer Path
- How Each Attribution Model Works and When to Use It
- Setting the Lookback Window for Affiliate Clicks
- Separating Credited Revenue from Incremental Revenue
- Reading Results and Avoiding Common Pitfalls
- Choose the Model and Window Before Comparing Partners
What Attribution Analysis Measures
Attribution analysis assigns conversion credit to eligible interactions, or touchpoints, using a rule or algorithm. It describes how recorded journeys receive credit. It doesn't automatically establish that a particular interaction caused a purchase.
A Think with Google industry benchmark found that 81% of companies used marketing attribution in 2017, yet 44% of those adopters relied on last-click attribution. Adoption alone therefore doesn't tell an analyst whether a report recognizes discovery, consideration or only the final interaction.
A single hypothetical customer journey
Consider a hypothetical shopper buying from a merchant:
- Day 0, affiliate publisher: The shopper reads a product review and clicks its affiliate link.
- Day 6, paid social: The shopper clicks an advertisement.
- Day 12, email: The shopper opens a promotional email and clicks through.
- Day 14, branded search: The shopper searches for the merchant by name, clicks a result and completes a $200 purchase.
The calculations use the email click, not merely its open. Mixing opens, impressions and clicks without declaring eligibility rules would make the comparison ambiguous.
The merchant sells the product; the publisher refers traffic. An affiliate network or tracking software provider may record the referral, while an agency or OPM may manage the program. These participants have different roles and shouldn't be treated as interchangeable channels.
Measurement boundary: A revenue allocation isn't a commission payment. Contractual payout rules can differ from the merchant's analytical attribution model.
Before interpreting credit, analysts should verify how the journey was captured. Affiliate's guide to how affiliate tracking works explains the technical foundation behind those records.
Five Attribution Models Applied to One Customer Path
Credit for one hypothetical $200 affiliate path by attribution model
| Touchpoint | Last-click | First-click | Linear | Time-decay | Data-driven |
|---|---|---|---|---|---|
| Affiliate publisher click, day 0 | 0% ($0) | 100% ($200) | 25% ($50) | 9.9% ($19.82) | Estimated from account-wide paths |
| Paid social click, day 6 | 0% ($0) | 0% ($0) | 25% ($50) | 18.0% ($35.91) | Estimated from account-wide paths |
| Email click, day 12 | 0% ($0) | 0% ($0) | 25% ($50) | 32.5% ($65.02) | Estimated from account-wide paths |
| Branded search click, day 14 | 100% ($200) | 0% ($0) | 25% ($50) | 39.6% ($79.26) | Estimated from account-wide paths |
The rule definitions and seven-day half-life used for this hypothetical calculation follow Google's legacy attribution model documentation. These are analytical comparisons, not a claim that every model remains selectable in current analytics reports.
Last-click assigns the entire purchase to branded search. First-click assigns it to the affiliate publisher. Linear attribution divides the hypothetical purchase value equally: $200 ÷ 4 = $50 per click.
Reproducing the time-decay calculation
Time-decay first assigns each click a weight based on its distance from conversion:
Weight = 0.5^(days before conversion ÷ 7)
For the hypothetical path:
- Publisher: The click occurred fourteen days before purchase, so its weight is 0.250.
- Paid social: Eight days before purchase produces a weight of approximately 0.453.
- Email: Two days before purchase produces approximately 0.820.
- Branded search: The same-day click receives a weight of 1.000.
The combined weight is approximately 2.523. Each channel's share equals its weight divided by that total; multiplying the share by the purchase value gives credited revenue.
For the publisher, 0.250 ÷ 2.523 ≈ 9.9%, yielding approximately $19.82. Calculations retain unrounded weights before rounding the displayed results; the displayed currency allocations total a cent above the purchase value because of independent rounding.
The half-life also explains why an interaction eight days before conversion receives half the weight of an interaction one day before conversion. The difference is elapsed time, not evidence that the earlier publisher was less persuasive.
Why data-driven attribution has no hand-calculated answer
A single journey doesn't contain enough information to calculate data-driven shares. The algorithm needs broader observed conversion patterns, so inventing a neat distribution would misrepresent the method.
For additional campaign-level context, Silver Spoon Agency provides a resource to compare attribution models for campaigns.
The publisher's hypothetical credit ranges from $0 to $200 without any change in customer behavior. A partner comparison must therefore name the model before interpreting the result.
How Each Attribution Model Works and When to Use It
Attribution resembles deciding who receives a medal after a relay race. A rule can recognize the opening runner, the finisher or the whole team, but changing the medal rule doesn't change how the race unfolded.
Rule-based models apply explicit allocation instructions. Data-driven models estimate weights from observed behavior; they aren't a more complicated version of equal splitting.
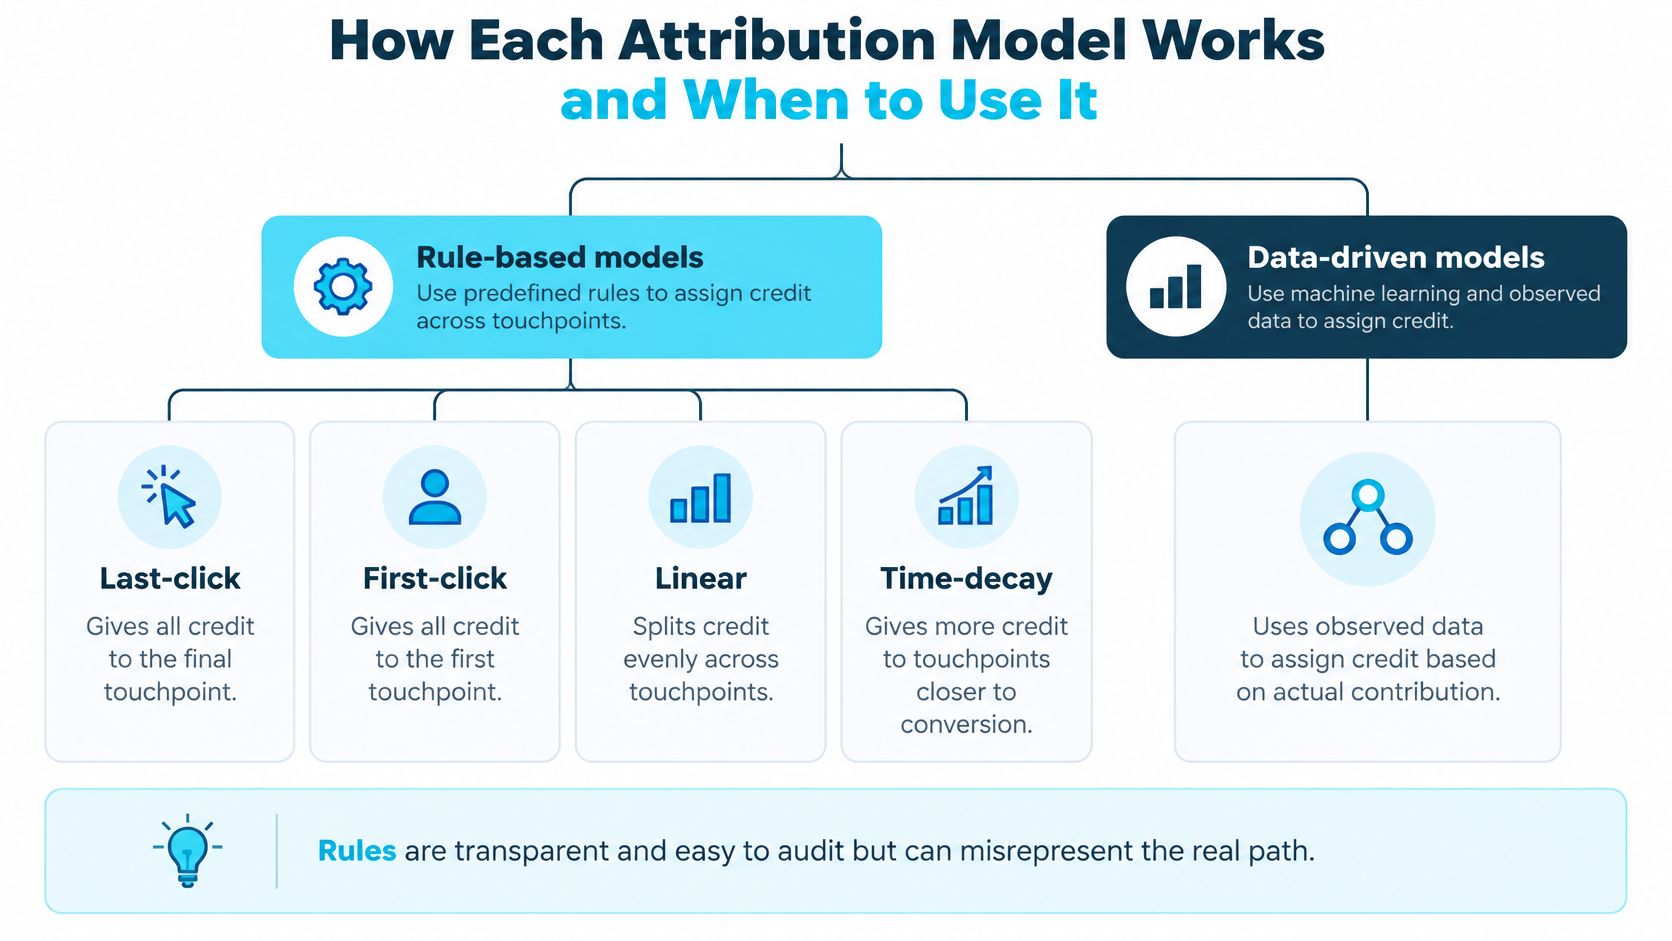
Attribution models compared by rule, fit and blind spot
| Model | Credit rule | Works best when | Main blind spot |
|---|---|---|---|
| Last-click | All credit to the final eligible click | Evaluating closing interactions in short cycles driven by branded search or coupon capture | Ignores discovery touchpoints |
| First-click | All credit to the first eligible click | Measuring which publishers start recorded journeys | Ignores nurturing and closing clicks |
| Linear | Equal share to every eligible click | Using equal contribution as a transparent baseline | Treats weak clicks as strong ones |
| Time-decay | More credit to clicks closer to conversion | Assessing recency in longer journeys with recent campaigns | Undervalues early affiliate discovery |
| Data-driven | Weights estimated from observed conversion paths | Accounts with substantial conversion activity and clean data | Can be opaque and can't be reproduced from one path by hand |
These are decision fits, not guarantees of accuracy. Last-click can help describe coupon capture without proving that coupon traffic created demand. Likewise, linear attribution is easy to audit, but equal treatment is an assumption rather than a finding.
Match the framework to the tool
Google Analytics documentation lists three models in its Attribution reports: data-driven, paid-and-organic last click, and Google-paid-channels last click. Under paid-and-organic last click, direct visits generally don't receive credit; the last eligible clicked channel receives the key-event value.
For journeys involving social advertising, Wojo Media's resource helps practitioners compare social media attribution models alongside broader campaign reporting.
Terminology also needs consistency across teams. Affiliate glossary gives plain definitions of EPC, attribution, payouts and other affiliate terms, helping program managers distinguish an allocation metric from a payment or efficiency metric.
Setting the Lookback Window for Affiliate Clicks
Suppose a publisher click occurs 45 days before a hypothetical purchase. It falls outside a 30-day lookback window, but could remain eligible within a 90-day window. Eligibility still doesn't guarantee credit, because the chosen model determines the allocation among qualifying interactions.
The lookback window is the cutoff for considering earlier touchpoints. Google Analytics' lookback-window guidance explains that a January 30 key event under a 30-day window can credit eligible touchpoints from January 1 through January 30. Acquisition events such as first_open and first_visit default to 30 days, with a 7-day option; other key events, including many purchases and leads, default to 90 days.
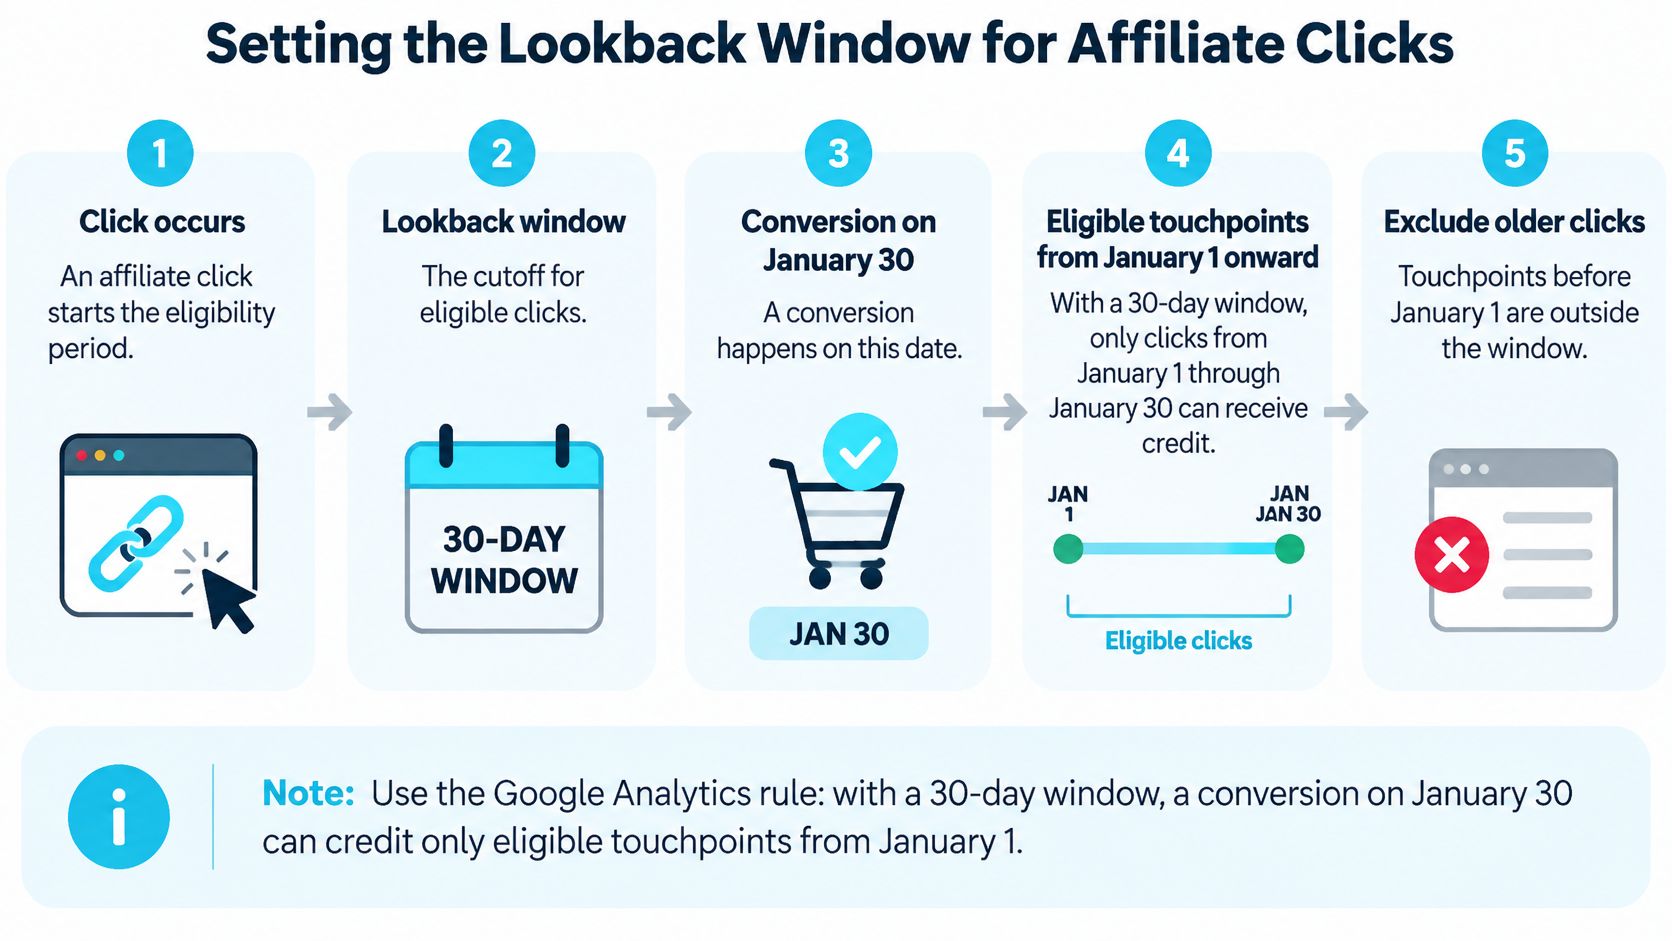
Choose the cutoff from observed purchase timing
High-consideration purchases can involve extended comparison before checkout. Coupon and loyalty interactions may occur much closer to purchase, so a restrictive cutoff can exclude discovery publishers while preserving closing interactions.
- Measure the purchase gap. Calculate the median and the 90th percentile of elapsed time from first affiliate click to purchase in the merchant's own records. The median describes the typical recorded journey; the percentile reveals the longer tail.
- Inspect event defaults. Check the actual setting for each conversion event rather than assuming that acquisition and purchase events use identical windows.
- Match eligibility to the journey. Cover most of the observed gap, then check compatibility with program terms and tracking persistence. The guide to affiliate program cookie duration explains why contractual cookie duration and analytical eligibility shouldn't be treated as interchangeable.
- Compare alternative windows. Hold the model and conversion cohort constant while changing the cutoff. Inspect which partners gain or lose credited revenue.
- Document the choice. Record the event, window, rationale and effective configuration so reports remain comparable.
PlatformDTC's explanation can help teams compare attribution window settings when reviewing terminology across tools.
A longer window expands eligibility. It doesn't establish that an older interaction influenced the purchase.
Extending the cutoff can recognize earlier publishers, but it can also include purchases that would have occurred without their involvement.
Separating Credited Revenue from Incremental Revenue
A shopper searches for a merchant by name, intends to buy, then visits a coupon publisher before checkout. Last-click may credit that publisher with the sale even when the shopper would have purchased without the coupon interaction.
A Journal of Digital & Social Media Marketing article indexed by EconPapers recommends combining multi-touch attribution, marketing mix modeling and randomized incrementality tests. The distinction is practical: credited revenue follows an allocation method; incremental revenue estimates the additional revenue generated by an intervention.
A hypothetical coupon-program holdout
Suppose eligible users are randomly assigned to program exposure or a holdout. All figures below are hypothetical, and the expected row is a calculation rather than a separately observed group.
Hypothetical holdout test for a coupon program
| Group | Users | Conversions | Conversion rate |
|---|---|---|---|
| Exposed to affiliate program | 9,000 | 450 | 5.0% |
| Holdout, not exposed | 1,000 | 42 | 4.2% |
| Expected exposed conversions at holdout rate | 9,000 | 378 | 4.2% |
The arithmetic follows directly:
- Baseline expectation: 9,000 × 4.2% = 378 conversions.
- Estimated incremental conversions: 450 − 378 = 72 conversions.
- Incremental share of exposed conversions: 72 ÷ 450 = 16%.
Suppose last-click reporting credits the coupon publisher with 300 conversions in this same hypothetical campaign. The estimated increment equals 72 ÷ 300 = 24% of that credited count.
Multi-touch attribution would instead divide credit across eligible interactions. Its exact publisher allocation can't be calculated without the campaign's full paths and chosen model.
Apply the result without overstating certainty
The test estimates incremental conversions for the intervention tested, not the identity of individual purchases that were caused. Assigning the entire estimate to a particular publisher requires a publisher-specific experiment, effective exposure control and checks for contamination, sample adequacy and statistical uncertainty.
Upper-funnel publishers can also perform better in lift tests than their click reports suggest. Converting lift into incremental revenue requires observed order values; profitability then requires costs and margins, as the distinction between ROI and ROAS makes clear.
Commission reviews should respect existing agreements. Budget a controlled test for partners whose credited activity and additional demand may diverge before negotiating future terms.
Reading Results and Avoiding Common Pitfalls
In 2024, 80% of marketers were dissatisfied with their ability to reconcile results from different measurement tools, according to the Mobile Marketing Association's State of Attribution report. Mismatched totals deserve investigation, but they don't automatically mean that either system is broken.
Common attribution result patterns and what to check
The following are diagnostic starting points, not definitive explanations.
| Pattern | Likely cause | Check before acting |
|---|---|---|
| Partner credit jumps after a model change | The model changed, not necessarily the partner | Rerun both models on the same window |
| High affiliate credit but few new customers | Possible coupon or loyalty capture | Split credit by new versus returning customers |
| Network and analytics totals differ | Different tracking, windows or deduplication | Reconcile click IDs and window settings |
| Conversions credited to direct traffic | Missing tags, cross-device gaps or cookie expiry | Audit tagging and consent settings |
| Upper-funnel publisher looks weak | Last-click ignores assisting clicks | Compare assisted conversions and run a holdout |
A reconciliation should connect the network's transaction records with the merchant's order records and analytics events. Check time zones, cancellations, refunds, event duplication and whether revenue includes taxes or shipping before comparing totals.
The reconciliation workflow should remain visible to everyone interpreting the reports.
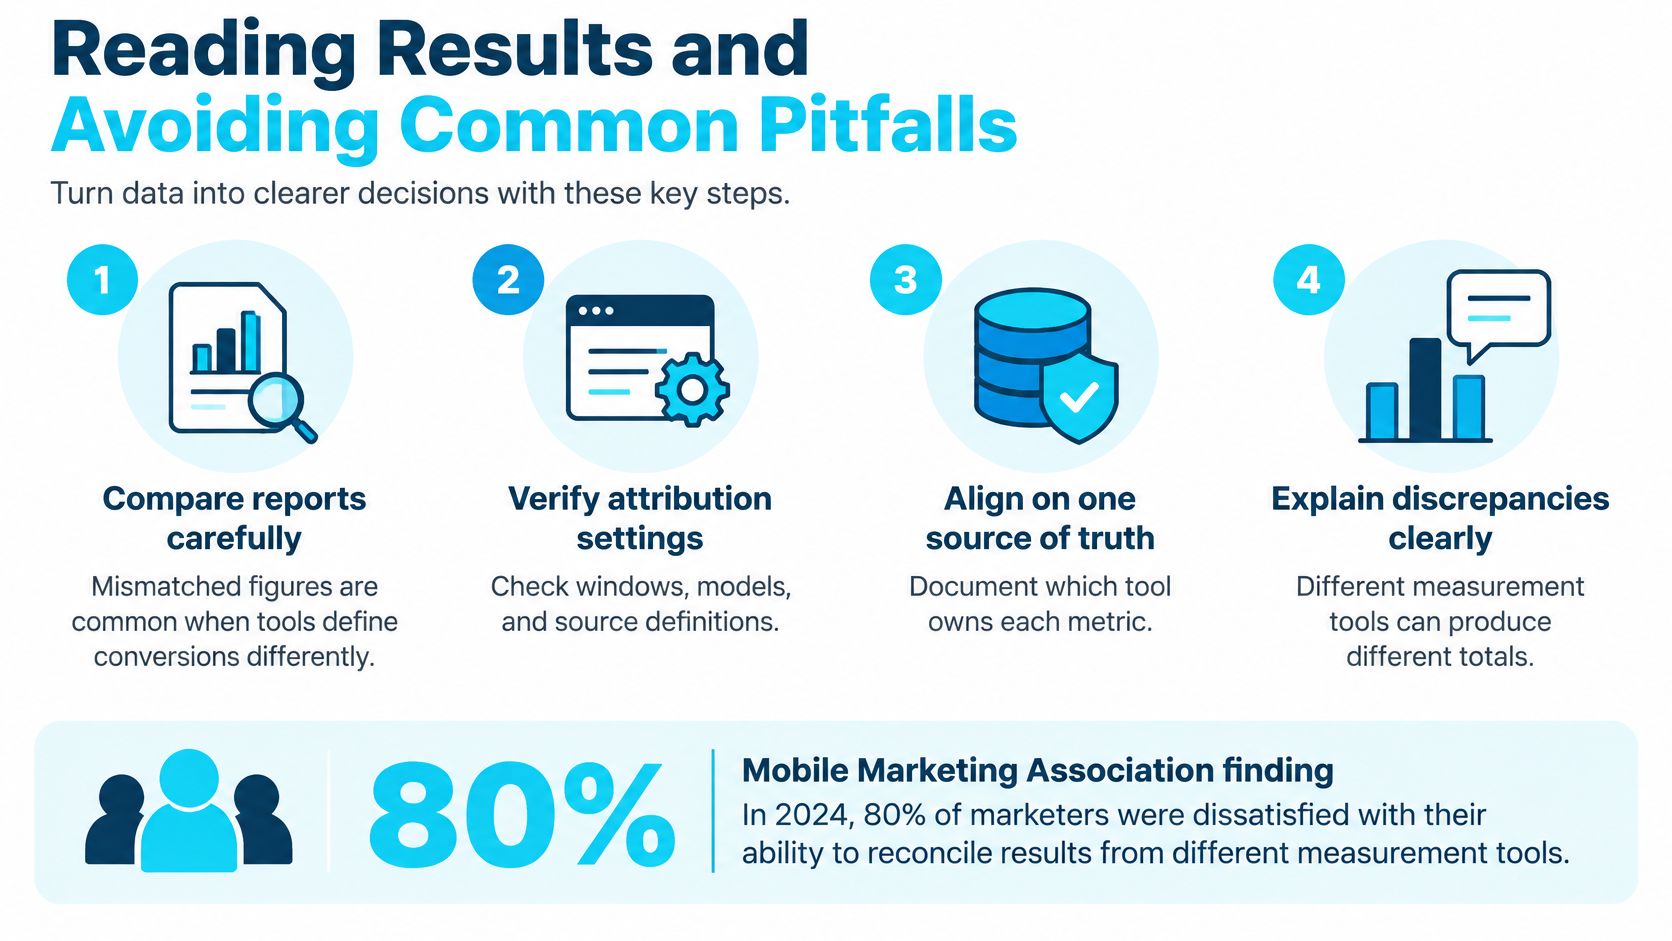
Pitfalls that change the conclusion
- Unequal windows: Comparing different eligibility periods changes which interactions can appear.
- Model changes mistaken for performance changes: A redistribution of credit isn't evidence that a publisher's audience improved.
- Small samples: A handful of purchases can materially alter rankings, especially when order values differ.
- Seasonal snapshots: A monthly result may reflect promotions, availability or seasonal demand rather than a durable partner advantage.
Program teams should align attribution with their wider affiliate marketing KPI framework, rather than letting credited revenue stand in for every measure of quality.
Before changing payouts: Resolve the metric definition before debating the partner's performance.
The final verification questions are concrete: Are conversion definitions, windows and customer classifications aligned? Have duplicate and reversed orders been removed consistently? Is the sample adequate, and does the proposed decision rely on allocation evidence or an actual lift estimate?
Choose the Model and Window Before Comparing Partners
The decision should come before the report. A commission negotiation, publisher-selection exercise and cross-channel budget shift don't necessarily require the same measurement framework.
Establish a decision-ready comparison
- Name the action. Specify whether the analysis will inform a future commission rate, investment allocation or partner shortlist. Define the commercial outcome that matters.
- Record primary and secondary models. Choose the main model for the decision and a contrasting model as a sensitivity check. Avoid selecting whichever makes a favored partner look strongest.
- Set the eligibility window. Use observed click-to-purchase timing and apply the chosen cutoff consistently across comparable partner activity.
- Plan an incrementality test. Include a holdout or geographically controlled experiment where reported credit may diverge from additional demand. Confirm that the intervention can be withheld.
- Standardize the report. Document settings, conversion definitions, revenue treatment, customer segments and exclusions before distributing partner results.
Evaluate whether the technology permits verification
Networks and tracking providers should be assessed for model selection, configurable lookback windows and exportable click-level records. Order identifiers, timestamps and deduplication documentation help analysts explain differences rather than merely observe them.
Agencies and OPMs should document their reporting assumptions; merchants should own the commercial decision and conversion definition. A provider's dashboard shouldn't become the default authority because its totals are easiest to export.
The final check is ranking stability. If changing the model changes the partner ranking, the decision isn't ready for a commission change on attribution evidence alone. The appropriate next action is a targeted test that resolves the disagreement.
Affiliate professionals connect with merchants, publishers, networks, agencies, tracking providers and other participants in the affiliate ecosystem. Its Commission Calculator under Resources & Tools can support payout planning once measurement assumptions are settled. Visit Affiliate Landscape to research potential partners and compare the capabilities needed for a verifiable attribution process.
Ready to explore the affiliate landscape?
Discover networks, tools, and opportunities in our directory.
Explore Directory