
Last updated: 15 July 2026
Track conversion rate, earnings per click (EPC), cost per acquisition (CPA), average order value (AOV), and return on ad spend (ROAS) as your core affiliate marketing KPIs. These five metrics reveal whether your program generates profitable revenue or merely attracts low-value traffic. Conversion rate shows what percentage of clicks become sales. EPC and CPA expose your cost efficiency. AOV and ROAS measure profit per customer. Most programs ignore one or two of these and leave money on the table as a result.
Word count: 82
Which Affiliate Marketing KPIs You Should Be Tracking
The core KPIs every affiliate program needs from day one are conversion rate, earnings per click (EPC), cost per acquisition (CPA), average order value (AOV), and return on ad spend (ROAS). Together, these five metrics tell you whether your program is generating profitable revenue or just traffic.
Most programs track far more than five metrics, and that is where things get messy. Irev's breakdown of affiliate performance tracking identifies conversion rate, CPA, ROI, customer lifetime value, and click-through rate as the five most commonly cited, which lines up closely with what working program managers actually pull from their dashboards week to week.
One honest caveat: no single KPI tells the full story. A high EPC can mask a low AOV. A strong conversion rate means little if your CPA exceeds the margin on the product. The metrics only become useful when you read them together.
This article covers each of those core KPIs in detail, including how to calculate them, what benchmarks to compare against, and how real programs have used them to make concrete decisions. It also covers secondary metrics worth monitoring once your program matures, and where most teams go wrong when they start building their reporting stack.
Affiliate Marketing KPIs to Track at a Glance
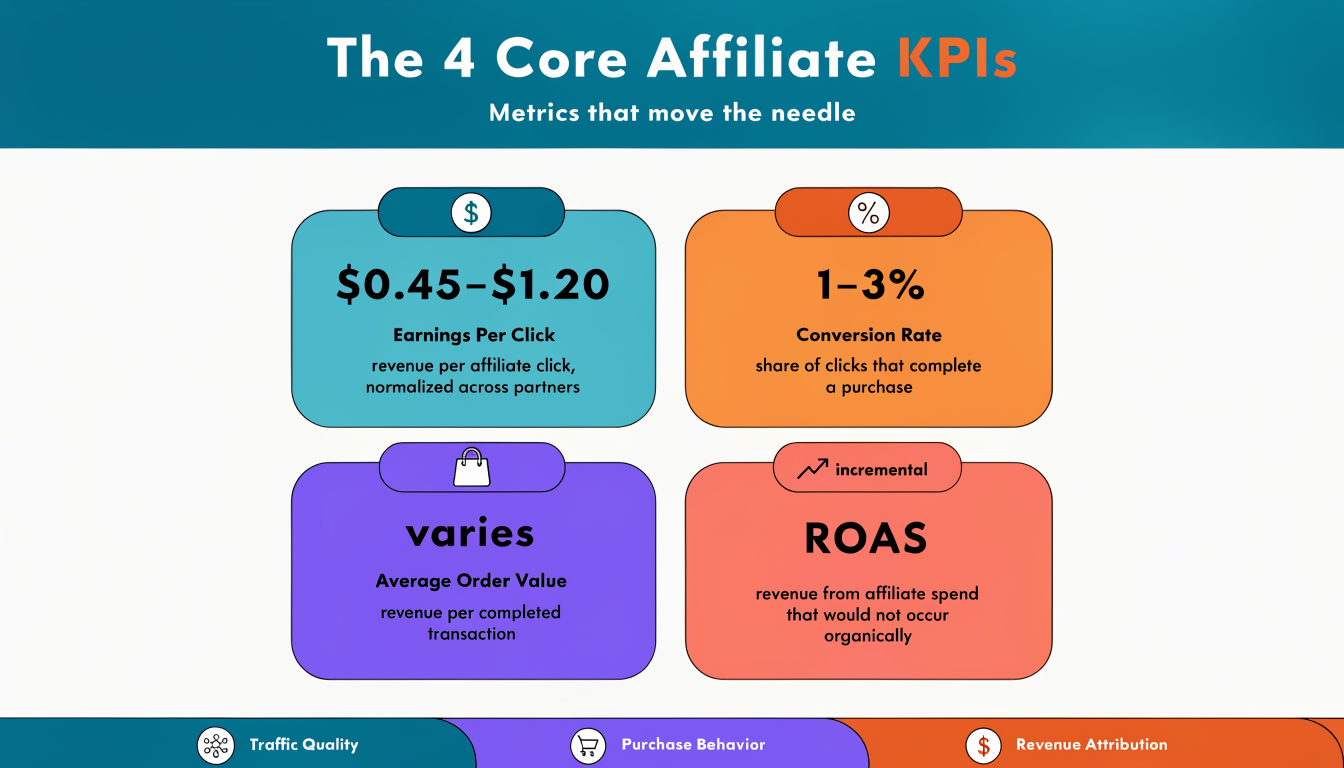
Four metrics give you a working picture of any affiliate program's health: earnings per click (EPC), conversion rate, average order value (AOV), and incremental ROAS. Track these before anything else. They cover traffic quality, purchase behavior, and whether your affiliate spend is generating revenue that would not have happened anyway.
- EPC measures revenue generated per click sent by an affiliate. It normalizes performance across partners with very different traffic volumes, so you can compare a niche blogger driving 500 clicks to a coupon site driving 50,000. Track360's 2026 cross-vertical benchmark puts median EPC between $0.45 and $1.20 depending on vertical, with finance and software at the high end.
- Conversion rate is the share of affiliate clicks that complete a target action, usually a purchase. The trade-off: a high conversion rate from a coupon affiliate often reflects customers who were already going to buy, not new demand your program created.
- AOV tells you whether affiliate traffic buys cheap or buys well. A partner with a 1.2% conversion rate but an AOV 40% above your site average may outperform a partner converting at 3%.
- Incremental ROAS is the hardest to measure and the most important. It strips out sales that would have occurred without the affiliate, giving you a truer read on program ROI. ReferralCandy's 2026 KPI analysis flags attribution accuracy as the central challenge, noting that most programs still rely on last-click models that inflate ROAS for bottom-funnel partners.
How Affiliate Marketing KPIs Actually Work
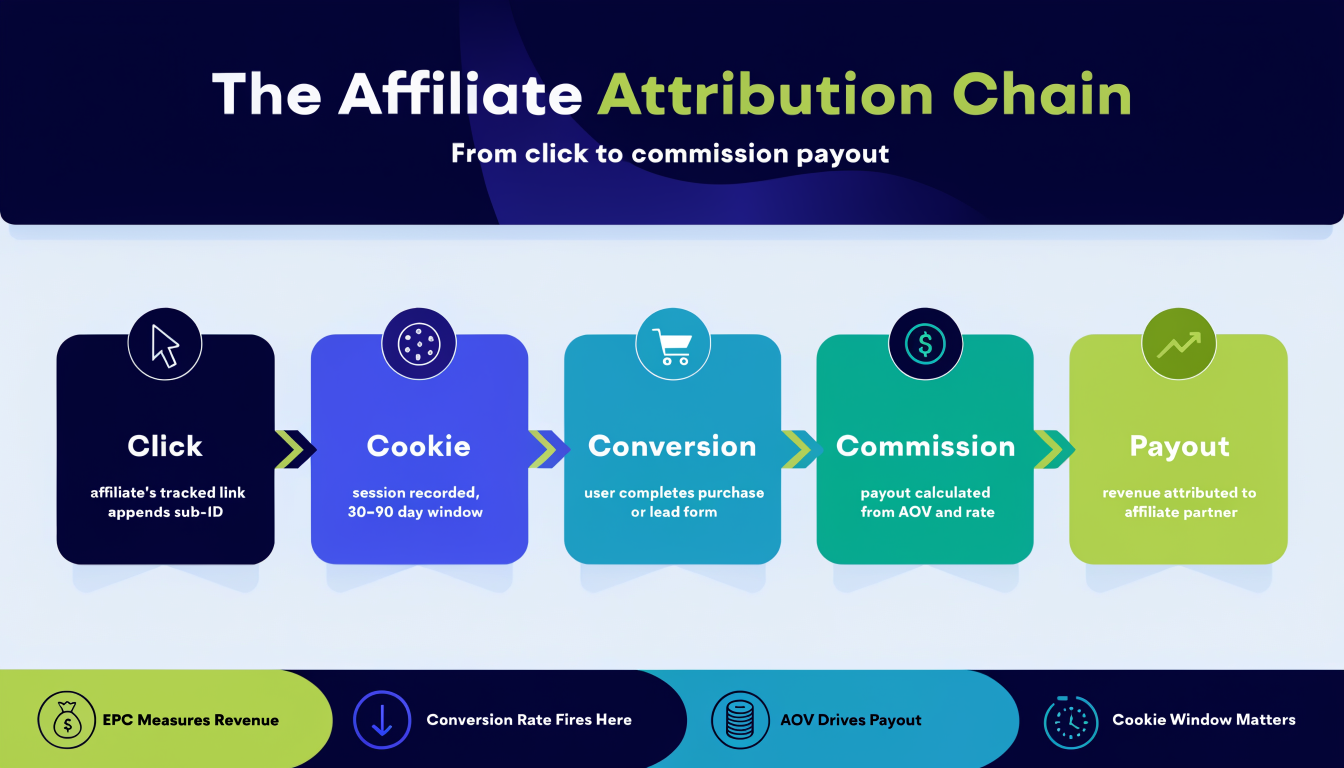
Affiliate marketing KPIs measure performance at each step of a defined chain: a user clicks a tracked link, a cookie records the session, a conversion event fires when the user completes a purchase or lead form, and that event triggers a commission payout. The metrics that matter, EPC, conversion rate, and average order value, each map to a specific point in that chain. Understanding which metric belongs where separates programs that optimize correctly from ones that chase the wrong numbers.
The Attribution Chain
Every affiliate transaction starts with a click. The affiliate's unique link appends a parameter, typically a sub-ID or affiliate ID, that the network or tracking platform reads and stores as a cookie. That cookie has a defined window, commonly 30 days for retail programs, though some SaaS programs run 90 days or longer. When the user converts within that window, the platform matches the conversion event back to the originating click and releases the commission.
The cookie window is where most attribution disputes originate. If a user clicks three different affiliate links before purchasing, the program's attribution model decides who gets credit. Last-click is still the most common default, but it systematically underpays top-of-funnel content affiliates who introduce the brand. Partnerize's affiliate KPI framework flags this as one of the most common structural problems in program management.
EPC as the Universal Health Signal
EPC, earnings per click, is calculated by dividing total commissions earned by total clicks generated. If an affiliate sends 1,000 clicks and earns $200 in commissions, their EPC is $0.20. That single number tells you more than click volume or raw revenue alone, because it normalizes performance across affiliates with very different traffic scales.
Publishers use EPC to compare programs. If your program pays a $30 commission on a product that converts at 1%, your EPC is $0.30. A competing program paying $20 on a product that converts at 2% delivers $0.40 EPC. The publisher will prioritize the second program even though the commission is lower, because the math is better. This is the mechanism behind why conversion rate improvements often do more for affiliate recruitment than commission increases.
Shopify's affiliate metrics guide identifies EPC alongside conversion rate and AOV as the core trio for evaluating affiliate campaign health, a grouping that reflects how these three metrics are interdependent rather than independent signals.
How Conversion Rate and AOV Set Commission Structure
Conversion rate and AOV interact in a way that directly constrains what commission rate is financially sustainable. A program with a 3% conversion rate and a $150 AOV generates $4.50 in revenue per click before any costs. A 10% commission on that AOV means $0.45 EPC for the affiliate, which is competitive in most verticals. Drop the conversion rate to 1% and that same 10% commission produces $0.15 EPC, which most content affiliates will deprioritize.
Commission structure decisions require actual math, not benchmarking alone. A flat percentage commission that looks generous on paper can still produce weak EPC if the product page converts poorly. Raising commission rates to compensate for low conversion rates increases payout costs without fixing the underlying problem. The better lever is usually landing page or funnel optimization, but that requires the brand to own the problem rather than pass it to the affiliate through higher rates.
Affiliate programs in categories with high AOV but low conversion rates, luxury goods or B2B software, often shift to flat-fee CPA structures for exactly this reason. A fixed $100 commission on a $2,000 software sale is only 5%, but if conversion rates run below 0.5%, the EPC math still works for affiliates who send qualified traffic.
When These KPIs Matter Most and What They Signal
Not every affiliate KPI deserves equal attention at every stage of a program. Click volume tells you almost nothing in a mature program with 200 active partners, and incremental ROAS is meaningless when you have 12. The metrics that matter shift as your program grows, and reading the wrong signal at the wrong stage leads to decisions that look rational on paper but cost real budget.
Early Stage: Clicks and Approval Rate Come First
When a program is new, revenue data is too thin to be statistically meaningful. A partner who drove three sales last month could be your best performer or a statistical fluke. At this stage, click volume and affiliate approval rate are the signals worth watching.
Click volume tells you whether your creative assets and commission structure are compelling enough to get partners to promote you at all. Approval rate, meaning the percentage of applicants you accept and who then actually activate, tells you whether your recruitment is attracting relevant traffic sources or just coupon sites looking for easy commissions. A healthy early-stage activation rate sits somewhere above 40%. Below that, the recruitment funnel itself needs attention before anything else.
Scaling Stage: EPC Tiers Identify Who Deserves More
Once you have 30 or more active partners generating consistent traffic, earnings per click becomes the most useful sorting tool you have. Calculate EPC at the individual partner level, then rank everyone into quartiles. The top 10% of partners by EPC almost always account for a disproportionate share of revenue, and those are the partners worth approaching with tiered commission offers, co-branded landing pages, or dedicated account management time.
AI Digital's 2026 KPI benchmarking analysis identifies conversion rate and revenue-per-click metrics as the primary signals for identifying high-value traffic sources worth additional investment. EPC tiers operationalize exactly that logic at the partner level.
One real trade-off: concentrating resources on your top EPC partners creates dependency. If two partners account for 60% of your affiliate revenue and one of them shifts focus to a competitor's program, your numbers drop fast. Use EPC tiers to guide investment, not to justify ignoring the mid-tier entirely.
Mature Program: Incremental ROAS Tests Whether Affiliates Are Earning Their Commission
A mature program with stable revenue often has a hidden problem: a significant portion of affiliate-attributed sales would have happened anyway. The customer was already searching for your brand, clicked a coupon affiliate's link at checkout, and the affiliate collected a commission for a sale you did not actually need help closing.
Incremental ROAS, measured through holdout testing or matched-market experiments, is the only metric that answers whether your affiliate spend is generating net-new customers or just paying for last-click attribution on existing demand. Running a 30-day holdout on your bottom-quartile partners by incrementality score often reveals that 20 to 30 percent of affiliate-attributed revenue carries close to zero incremental value.
This approach has real limits. Holdout testing requires enough traffic volume to produce statistically valid results, which means it works cleanly for large affiliates and becomes unreliable for partners driving fewer than a few hundred conversions per month. For smaller partners, proxy signals like new-to-file customer rate or average order value relative to your direct channel are more practical, if imperfect, substitutes.
A Step-by-Step Example: Reading a Real Affiliate Dashboard
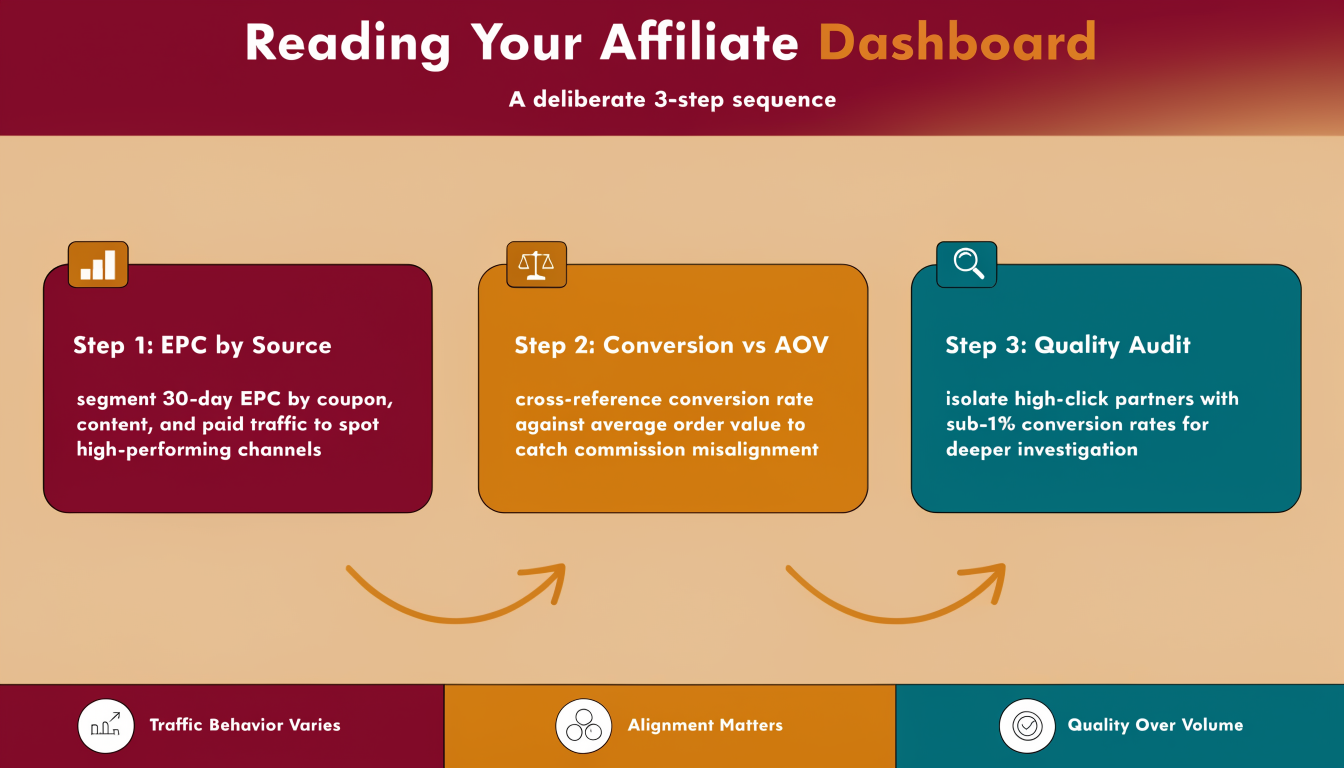
Reading an affiliate dashboard effectively means moving through the data in a deliberate sequence: start with earnings per click segmented by traffic source, cross-reference conversion rate against average order value to catch commission misalignment, then isolate high-click partners with sub-1% conversion rates for a quality audit. Done in that order, a 30-minute review can surface problems that would otherwise stay buried in aggregate numbers for weeks.
Step 1: Pull a 30-Day EPC Report and Segment by Traffic Source
Start by pulling EPC for the last 30 days, then break it out by traffic source: coupon, content, and paid. These three categories behave very differently. Coupon traffic typically shows high conversion rates but lower AOV because shoppers are already in buy mode and hunting a discount. Content traffic tends to show lower conversion rates but higher AOV and stronger new-to-file customer rates, because the affiliate introduced the product rather than just captured existing intent. Paid traffic varies widely depending on whether the affiliate is running brand-keyword bidding, which most programs should restrict by default.
If your coupon segment is generating 60% of attributed revenue but your new-to-file rate from that segment is under 15%, you have a cannibalization problem worth quantifying before your next commission review.
Step 2: Cross-Reference Conversion Rate Against AOV
Sort your partner list by conversion rate, then add an AOV column. Look for two patterns. First, partners with conversion rates above 4% and AOV more than 20% below your site average are almost certainly coupon or loyalty affiliates capturing late-stage buyers. Second, partners with conversion rates below 0.8% but AOV above your site average are likely content or comparison affiliates sending high-intent but low-volume traffic. Both groups are valuable, but they need different commission structures and different creative support.
A flat commission rate applied equally to both groups overpays the first and underpays the second. Most programs that have not segmented by this combination are leaving recruitment leverage on the table.
Step 3: Flag High-Click, Low-Conversion Partners for a Quality Audit
Any partner sending more than 500 clicks per month with a conversion rate below 0.3% warrants a traffic quality review. Pull their click log and look for bot-like patterns: clicks clustered in narrow time windows, unusual geographic distributions, or session durations under five seconds. Fraudulent traffic is less common than it was five years ago, but misaligned traffic, meaning real users who are simply not your customer, is extremely common and just as damaging to your EPC averages.
Contact the partner directly before taking action. Sometimes the problem is a misplaced banner on an unrelated page, which is fixable in a day. Other times the traffic source is genuinely incompatible with your product, and the right move is to pause the partnership rather than let it dilute your program's aggregate EPC.
Secondary Metrics Worth Adding Once Your Program Matures
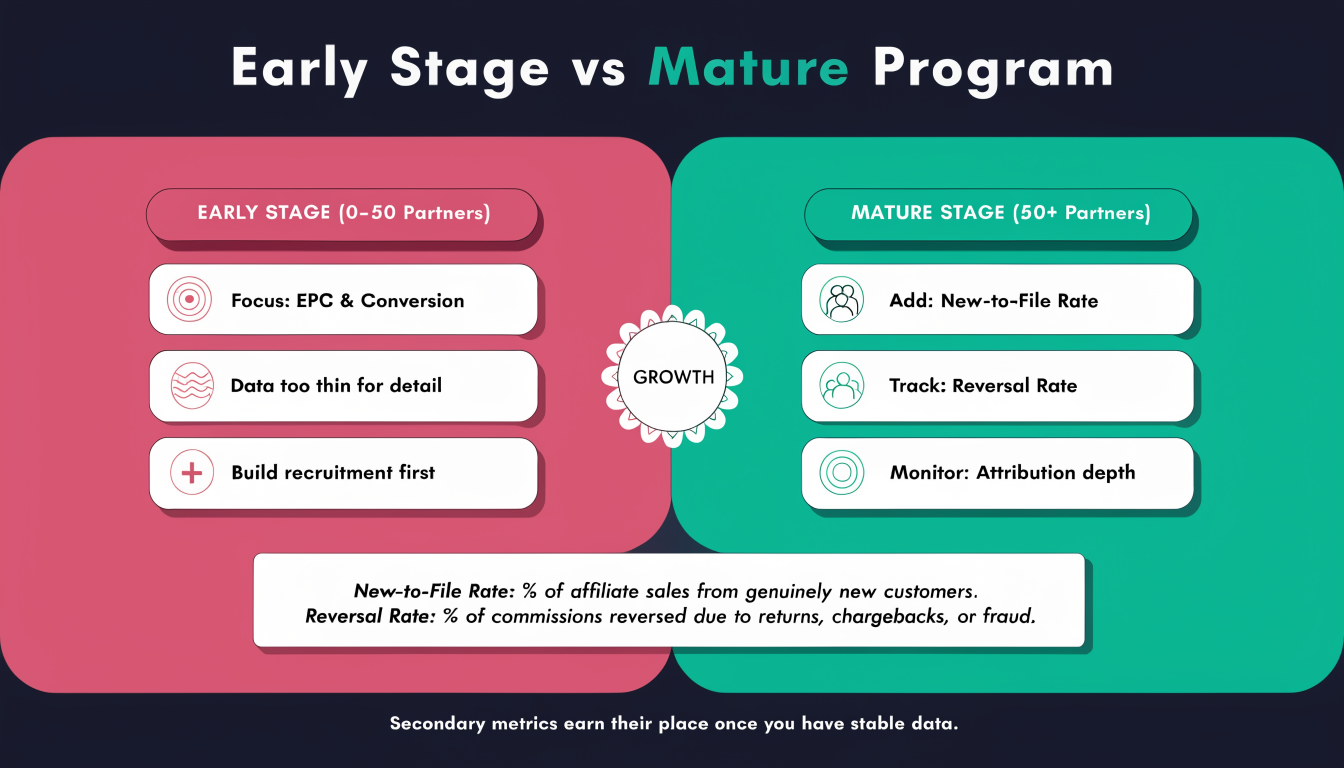
The five core affiliate marketing KPIs to track cover most decisions in a growing program. Once you have stable data across 50 or more active partners, a few secondary metrics start earning their place on the dashboard.
New-to-file customer rate measures what percentage of affiliate-driven buyers are genuinely new to your customer database. A program where 70% of affiliate sales go to existing customers is paying commissions for retention, not acquisition. That may be acceptable depending on your margin structure, but you should know it is happening.
Reversal rate tracks the percentage of approved commissions that get reversed due to returns, chargebacks, or fraud. A partner with a 12% reversal rate is significantly less valuable than their gross commission numbers suggest. Some networks report this automatically; others require you to calculate it manually from your order management system.
Time to first sale measures how long it takes a newly approved affiliate to generate their first conversion. The median across most programs is somewhere between 14 and 45 days. Partners who have been active for 90 days without a single sale are unlikely to activate without direct outreach, and that outreach is worth doing before you write them off entirely.
These secondary metrics do not replace the core five. They add context to decisions you are already making based on EPC, conversion rate, AOV, CPA, and ROAS.
Common Mistakes When Building an Affiliate KPI Stack
Most reporting problems in affiliate programs come from three places: tracking too many metrics too early, relying on last-click attribution without acknowledging its limits, and treating aggregate numbers as if they apply uniformly to every partner.
Tracking 20 metrics when your program has 15 active partners produces noise, not insight. The data is too thin to be meaningful at that granularity, and the time spent building reports is time not spent on recruitment or creative optimization. Start with EPC and conversion rate. Add AOV once you have enough transaction volume to see meaningful variation. Add incremental ROAS when you have partners generating at least 200 conversions per month.
Last-click attribution is not wrong, exactly. It is a reasonable default that becomes increasingly misleading as your program grows and your partner mix diversifies. If you have content affiliates introducing your brand at the top of the funnel and coupon affiliates capturing the sale at the bottom, last-click will systematically credit the coupon affiliate and starve the content affiliate of the commission that would keep them promoting you. Acknowledging this limitation does not require switching attribution models immediately. It does require factoring it into how you interpret your conversion rate data by partner type.
Aggregate numbers hide the most important decisions. A 2.1% program-wide conversion rate sounds healthy until you segment it and find that your top 10 partners convert at 4.8% and your bottom 40 convert at 0.6%. The aggregate tells you nothing actionable. The segmented view tells you exactly where to focus.
Frequently Asked Questions
What is the most important affiliate marketing KPI to track?
Earnings per click (EPC) is the single most useful starting point because it normalizes performance across partners with very different traffic volumes. A partner sending 200 clicks with a $1.20 EPC is more valuable than one sending 5,000 clicks at $0.08 EPC, and EPC makes that comparison immediate. Pair it with conversion rate and AOV to get a complete picture.
What is a good conversion rate for an affiliate program?
Conversion rates vary significantly by vertical and traffic type. Retail programs typically see 1% to 3% across their full partner mix, while software and SaaS programs often run below 1% because the purchase decision is longer. A more useful benchmark than a universal number: compare each partner's conversion rate to your direct-channel conversion rate on the same product pages. A partner converting at 60% of your direct rate is performing reasonably. One converting at 10% of your direct rate has a traffic quality or audience alignment problem worth investigating.
How do you calculate EPC in affiliate marketing?
Divide total commissions paid by total clicks generated over the same period. If your program paid $4,500 in commissions last month and affiliates sent 12,000 clicks, your program-level EPC is $0.375. Calculate this at the individual partner level to identify your highest-value traffic sources. Most affiliate networks surface EPC in their standard reporting, but calculating it yourself from raw data lets you apply consistent date ranges and exclude reversed commissions.
What is incremental ROAS and why does it matter?
Incremental ROAS measures the return on affiliate spend after removing sales that would have occurred without the affiliate's involvement. Standard ROAS counts every attributed sale at face value. Incremental ROAS runs holdout tests or matched-market experiments to estimate how many of those sales were genuinely driven by the affiliate versus captured from existing demand. The gap between the two numbers is often 20 to 40 percent in mature programs with heavy coupon affiliate participation. Knowing that gap tells you whether your commission budget is acquiring new customers or subsidizing purchases that were going to happen anyway.
How often should you review affiliate KPIs?
Weekly reviews of EPC, conversion rate, and click volume catch problems before they compound. Monthly reviews of AOV, CPA, and reversal rate give you enough data to see meaningful trends rather than weekly noise. Incremental ROAS analysis makes sense quarterly, since holdout tests need at least 30 days of data to produce reliable results and running them continuously disrupts your ability to measure anything cleanly. The cadence matters less than consistency: a monthly review done every month beats a weekly review done whenever someone has time.
What is a reversal rate in affiliate marketing?
A reversal rate is the percentage of initially approved affiliate commissions that get cancelled after the fact, usually because the underlying order was returned, charged back, or flagged as fraudulent. If an affiliate generated 100 approved commissions last month and 14 were later reversed, their reversal rate is 14%. High reversal rates, generally anything above 10%, reduce the effective value of a partner's traffic and can indicate audience mismatch, misleading promotional content, or in rare cases, deliberate fraud. Most networks track this, but you may need to pull it manually if your platform does not surface it by default.
If you want a clearer view of which affiliate marketing KPIs to track for your specific program, visit Affiliatelandscape to see how their team approaches program audits, partner segmentation, and attribution strategy. Getting the metrics right from the start saves a significant amount of budget that would otherwise go to partners who are not moving the needle.
Ready to explore the affiliate landscape?
Discover networks, tools, and opportunities in our directory.
Explore Directory